
Five things we did at Chicago Public Media to break down data silos
Two years ago, Chicago Public Media faced a problem familiar to many news organizations: every department tracked metrics, but nobody could explain how those metrics dialed up to our organizational North Star of doubling digital membership, nor were there any cohesive actions to reach that goal.
Each department updated a massive spreadsheet every month with hundreds of data points. Editorial engagement lived in one tab, membership conversions in another, marketing performance in a third.
We had all this valuable audience data that could help us achieve our objectives, but it lived in silos, and there was no clear, central story about what we should do with it.
As members of the three-person audience insights team, we were frustrated watching good insights get stuck in tabs and one-off analyses. We knew that if we wanted to make data-driven decisions that were useful toward our North Star, we had to coordinate around the data, not just collect it. It took us 18 months, but now data is the bridge that ignites collaboration across departments.
Here are five strategies and tactics that proved effective at bringing aligned, data-driven decision-making to our organization:
A weekly funnel meeting
Turn ideas into testable growth tactics
Metrics trees built with teams, not imposed on them
An executive who actively champions data
Shift from a service desk to strategic leaders
1. A weekly funnel meeting
In early 2024, our team finished an analysis called "What We Know About Membership." We used internal data to segment our audience into three groups: members, loyal users, and everyone else.
It gave Chicago Public Media a new, more detailed view of the membership funnel, which characterized each of our user segments by what they read, how they interacted with our products, and how often they visited. We learned that the newsletter-to-member conversion journey took much longer than we expected. Although some of our high-traffic content kept loyal readers highly engaged with recirculation and average time spent, conversion rates remained surprisingly low.
The analysis revealed opportunities and questions that we knew would benefit from cross-functional discussion, so we launched a funnel strategy group. The group, which included audience, product, circulation, marketing, and membership leaders, met every Friday for an hour.
The goal of the meeting was simple: Figure out how to move people further down the funnel. Every week, we looked at how we were performing at every stage of the funnel and discussed tactics for improving that performance.
The meetings were a hit. Most of the 12 people we originally invited showed up every week. And looking at the same numbers every week with the same people from across different departments inspired shared curiosity and questions: How can we improve the conversion rate of loyal homepage visitors to newsletter subscribers? What web behaviors are correlated with membership and how is this changing over time?
Now we’re using these meetings to evaluate Sun-Times user touchpoints across our website, inspired by a Figma file someone created that maps every stage of the New York Times’ lifecycle. It’s been both fun and enlightening to collectively grade ourselves on each stage (awareness, consideration, exploration, onboarding, purchase, etc.) to learn where we’re strong and where we can improve.
Cross-departmental collaboration builds shared understanding and alignment around data. The key to getting to this point has been genuinely following up on questions and ideas that people surface in the meeting. We use these funnel meetings to dig into how we can act on our insights and encourage people to actually act on ideas. Because it is a weekly routine, those ideas don’t just die in Slack threads or get forgotten. All of this demonstrates that the meeting is a good use of participants’ time and keeps them coming back every week.
2. Turn ideas into testable growth tactics
Once we had a weekly rhythm going, our funnel meetings became a place where we'd pitch ideas for tests and share results. We made a simple test proposal form requiring people to connect each experiment idea to loyalty or conversion outcomes.
Test ideas came from everywhere: something we noticed in the funnel data, an observation from our audience engagement editor, challenges that kept coming up in meetings. Achieving test alignment meant finding the right balance between departmental objectives and our overarching North Star goals. We prioritized tests that tackled our biggest conversion bottlenecks or could be done quickly with tools we already had.
One example: someone suggested that highly engaged readers might respond to different membership pricing than everyone else. So we tested higher priced options ($9/month, $75/year, $150/year) and standard pricing on our most engaged segment. The higher priced options generated about 18 times more revenue than the standard options and actually converted 2.6 times more conversions.
When we tried the same test on moderately engaged readers, we only got three conversions, total. This highlights a challenge we face with most of our membership tests – not getting enough interactions for a clear signal. Reaching statistical significance would have taken months, but we’ve learned to act on strong directional trends like that while being careful about other factors that might confound our results.
3. Metrics trees built with teams, not imposed on them
By 2025, each team was tracking and monitoring multiple KPIs, but they struggled to understand how those KPIs laddered up to our North Star goal of doubling digital membership.
Inspired by the Financial Times, Director of Audience Insights Sarah Darby pitched us on developing our own metrics tree. Metrics trees are visual maps that show how department-level metrics connect to the main business objective – in our case, the total number of digital members.
We started by meeting with key departments (marketing, circulation, product, engineering, and membership) in June 2025. We asked them two questions:
Of the metrics you’re already tracking, which ones do you find most actionable and valuable?
What metrics aren't you tracking that could help your team understand how their work contributes to company goals?
We had them group these metrics into stages of the audience journey (awareness, engagement, acquisition, retention, and winback) so that they could see where the bulk of the metrics were sitting and what stages (if at all) they needed more visibility into.
The biggest challenge was getting people to agree to set aside certain metrics they were tracking – teams understandably wanted to measure lots of things, but we wanted them to zero in on a smaller number of more meaningful metrics that they could influence through their work and that would actually move the needle on membership growth.
After each department developed a few iterations of these metrics trees, we brought all the departments together to share their final drafts with each other. As a result, each team left with a stronger understanding of their priority metrics and new opportunities to align with and support other teams.
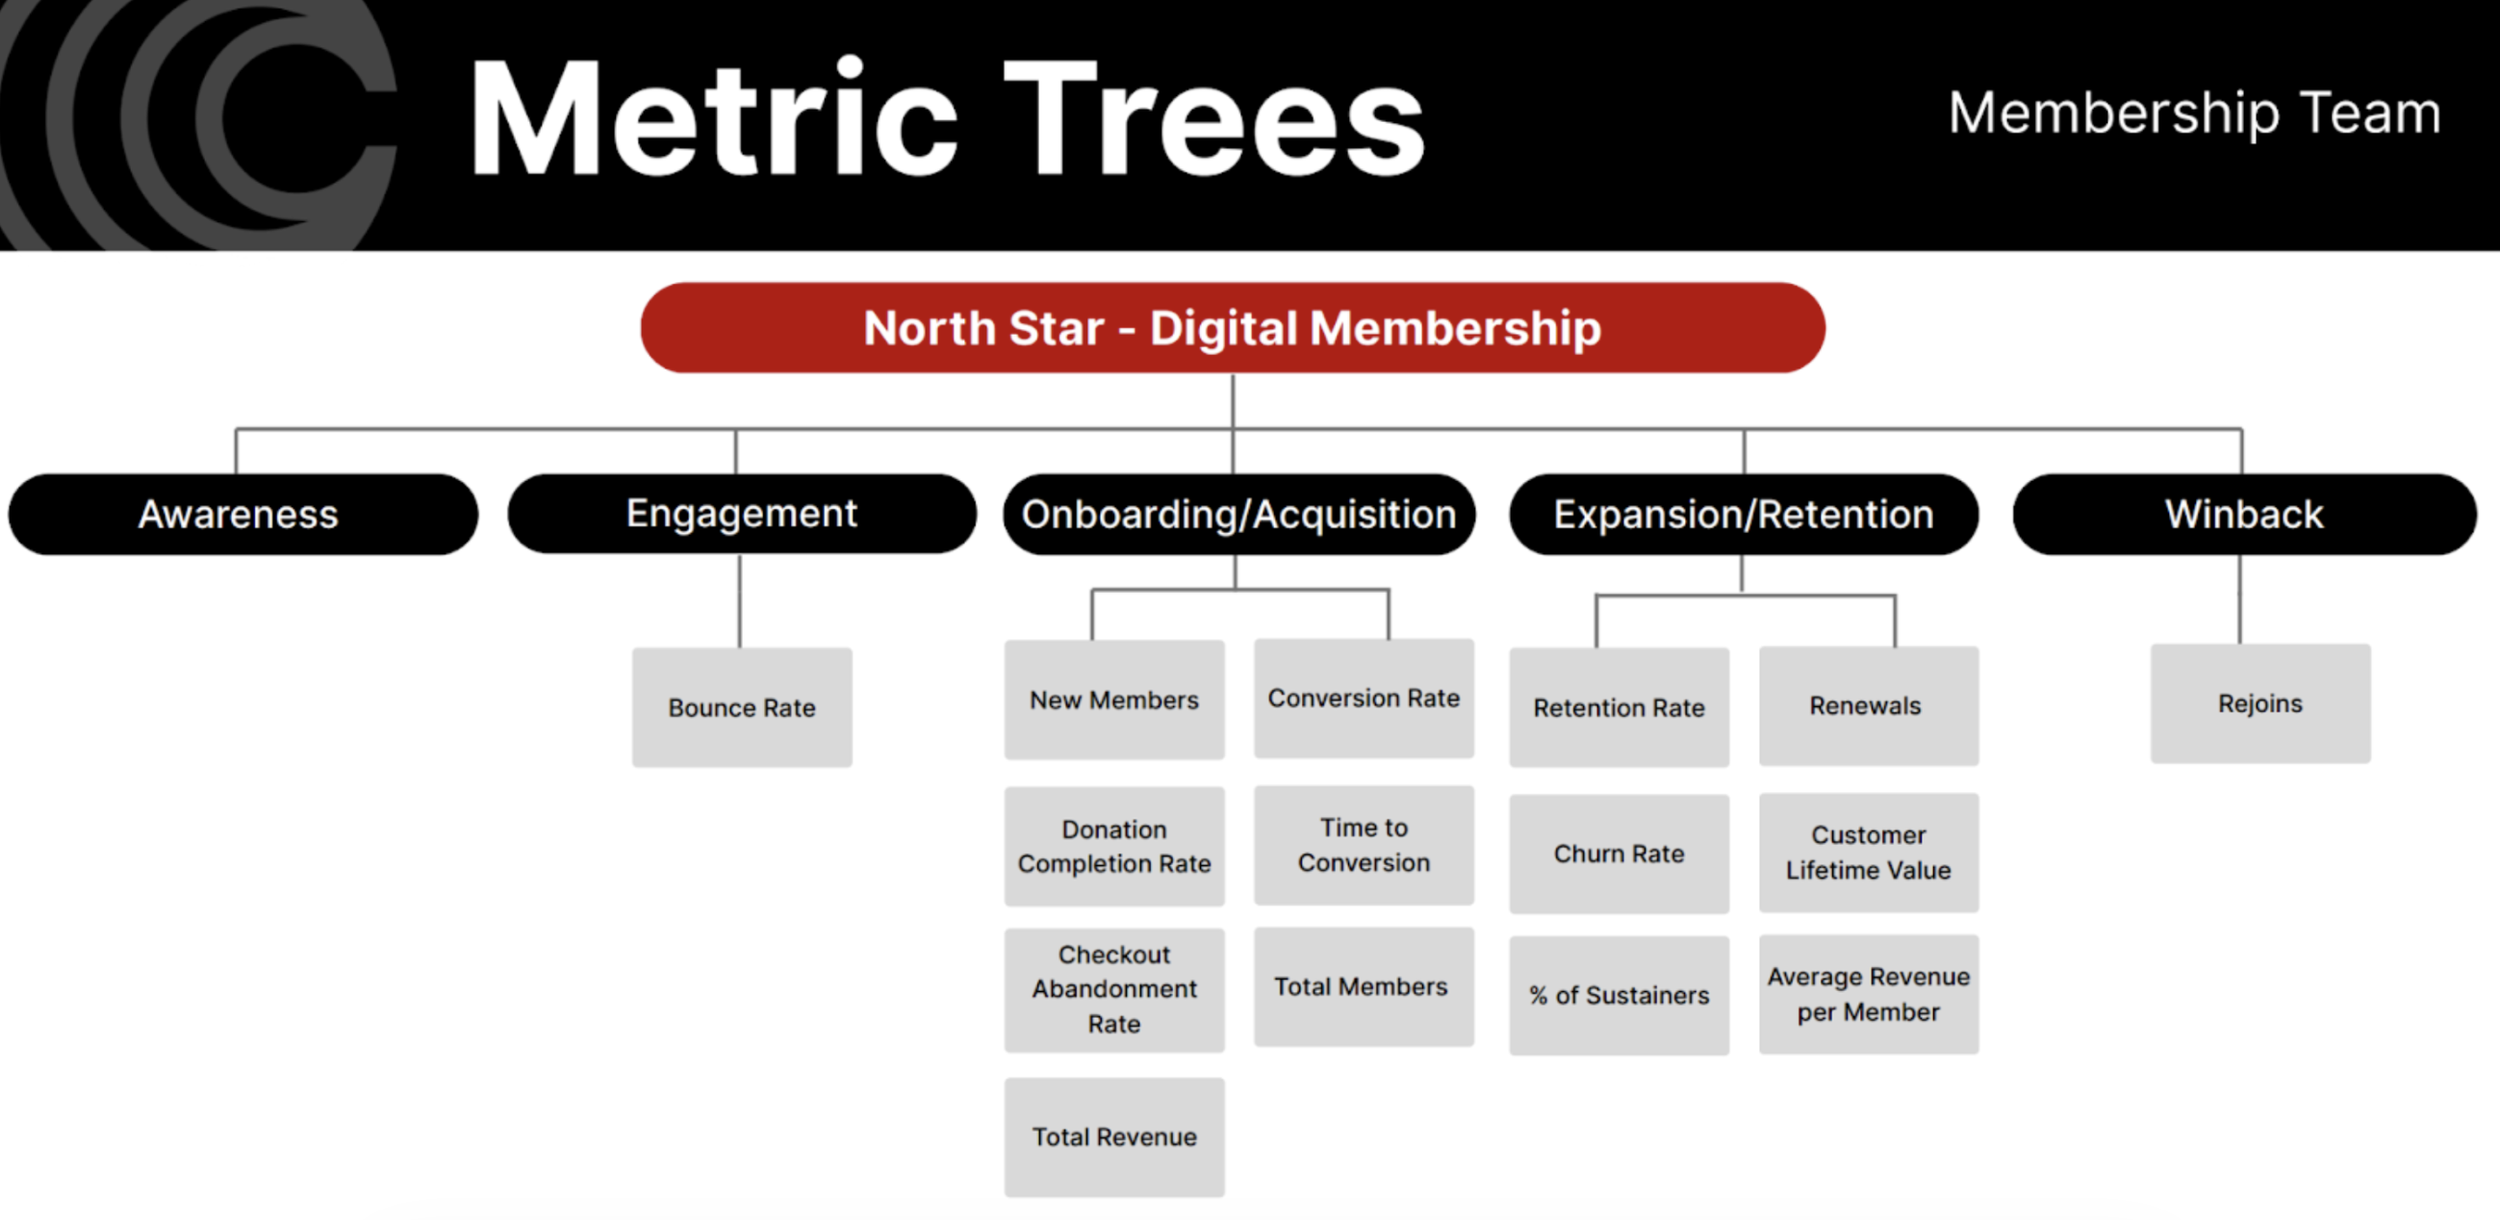
An example of the membership team’s final metric tree
Our next step is to build out a comprehensive view of the North Star Dashboard with both executive and departmental views so teams can both see their tree and zoom out to explore how different metrics connect across the organization.
4. An executive who actively champions data
Executive support can make or break data initiatives. Without it, data teams can get stuck in reaction mode, responding to ad-hoc requests without driving strategic change.
But executive support is about more than just saying data is important. Leaders need to actively engage with it and signal its value.
When Drew Brody joined Chicago Public Media as chief operating officer in the fall of 2024, he demonstrated this kind of engagement. He championed the development of our metrics tree project and offered valuable feedback on our monthly audience note, a performance update that tracks progress across brands against organizational goals.
His engagement with our work prompted a monthly meeting with the executive team, which gave the leadership team a regular space to ask questions about the data and develop a deeper understanding of it. It also helped the audience insights team identify what data mattered most at the leadership level and focus on that.
Brody also made it a priority to attend the funnel meetings as much as possible. His participation strengthened buy-in for experiments and decisions and signaled that executive leadership was invested in using data as a shared decision-making tool.
5. Shift from a service desk to strategic leaders
When Chicago Public Media first formed the insights team in 2024, most of our work was reactive, what we like to call "ad-hoc hell." Someone would email us asking for analysis or to fix a broken tool and we’d say yes, then get buried in follow-up requests, leaving us with little time for strategic work.
We knew we needed to change the dynamic and go from waiting for requests from other teams to pitching them on ways we could work together to achieve organizational goals.
We did that by establishing bi-weekly meetings with departmental stakeholders to review goals and performance and by joining existing audience engagement and editorial meetings.
We also started publishing a company-wide monthly audience note that highlighted what stories prompted the most donations, what loyal readers were reading, and where we were on our goals for membership, broadcast, podcasts, circulation, and other key areas.
This gave the organization regular visibility into audience insights that we had identified as most strategically valuable, which reduced the number of requests we got for analyses that did not dial up to those organizational objectives.
Through consistent communication, our team turned data into a practical tool for everyone, driving empowered decisions and measurable results across the organization.
The takeaway: Use data to start conversations, not end them
It took more than two years to get to where we are now – meaningful executive support for data initiatives, weekly meetings with consistently strong attendance, frequent tests, and a shared understanding and view of Chicago Public Media’s most meaningful KPIs.
The biggest difference: we stopped treating data as something to be emailed out or hidden in dashboards and started using it as a reason to bring people together.
We’ve made it a priority to convene stakeholders over metrics trees, ideas for tests, and funnel updates. Those conversations have led to more curiosity, better questions, and more useful decisions, ensuring that insights are a bridge, not a bottleneck or an end to the conversation.
Not every newsroom has an in-house analytics team to lead this work. If your data feels stuck in silos, start with just one weekly meeting where you come together to talk about one meaningful data point. You will be surprised how effective it can be.
“The First-Party Data Future” Series
Published:
Responsible Data Collection Strategies for News Organizations
How to break down data siloes and build data literacy across your organization
Coming soon:
Ideas to steal for strategic application of first-party data
A universal first-party data schema
Prompts for extracting strategic audience insights
How to change how we sell to leverage first-party data
Organizational and cultural requirements for a long-term first-party data strategy